- In 2017, there were 141 fatalities in collisions involving large trucks. In addition, 2% of the examined large trucks involved in fatal crashes had an apparent defect that may have contributed to the crash. (Ontario Ministry of Transportation, 2017)
- In 2017, there were 107 people killed in collisions involving an inattentive (distracted) driver. Inattentive driving was a factor in 17% of all fatalities on Ontario roads in 2017. (Ontario Ministry of Transportation, 2017)
- In 2017, 1,902 collisions involved a vehicle operator whose blood alcohol concentration (BAC) exceeded 0.08%, the legal limit for intoxication in Ontario. (Here, “operator” includes bicyclists and the operators of all types of motor vehicles, including all-terrain vehicles.) See the following chart for a breakdown of collisions by the age of the drunk vehicle operator. (Ontario Ministry of Transportation, 2017)
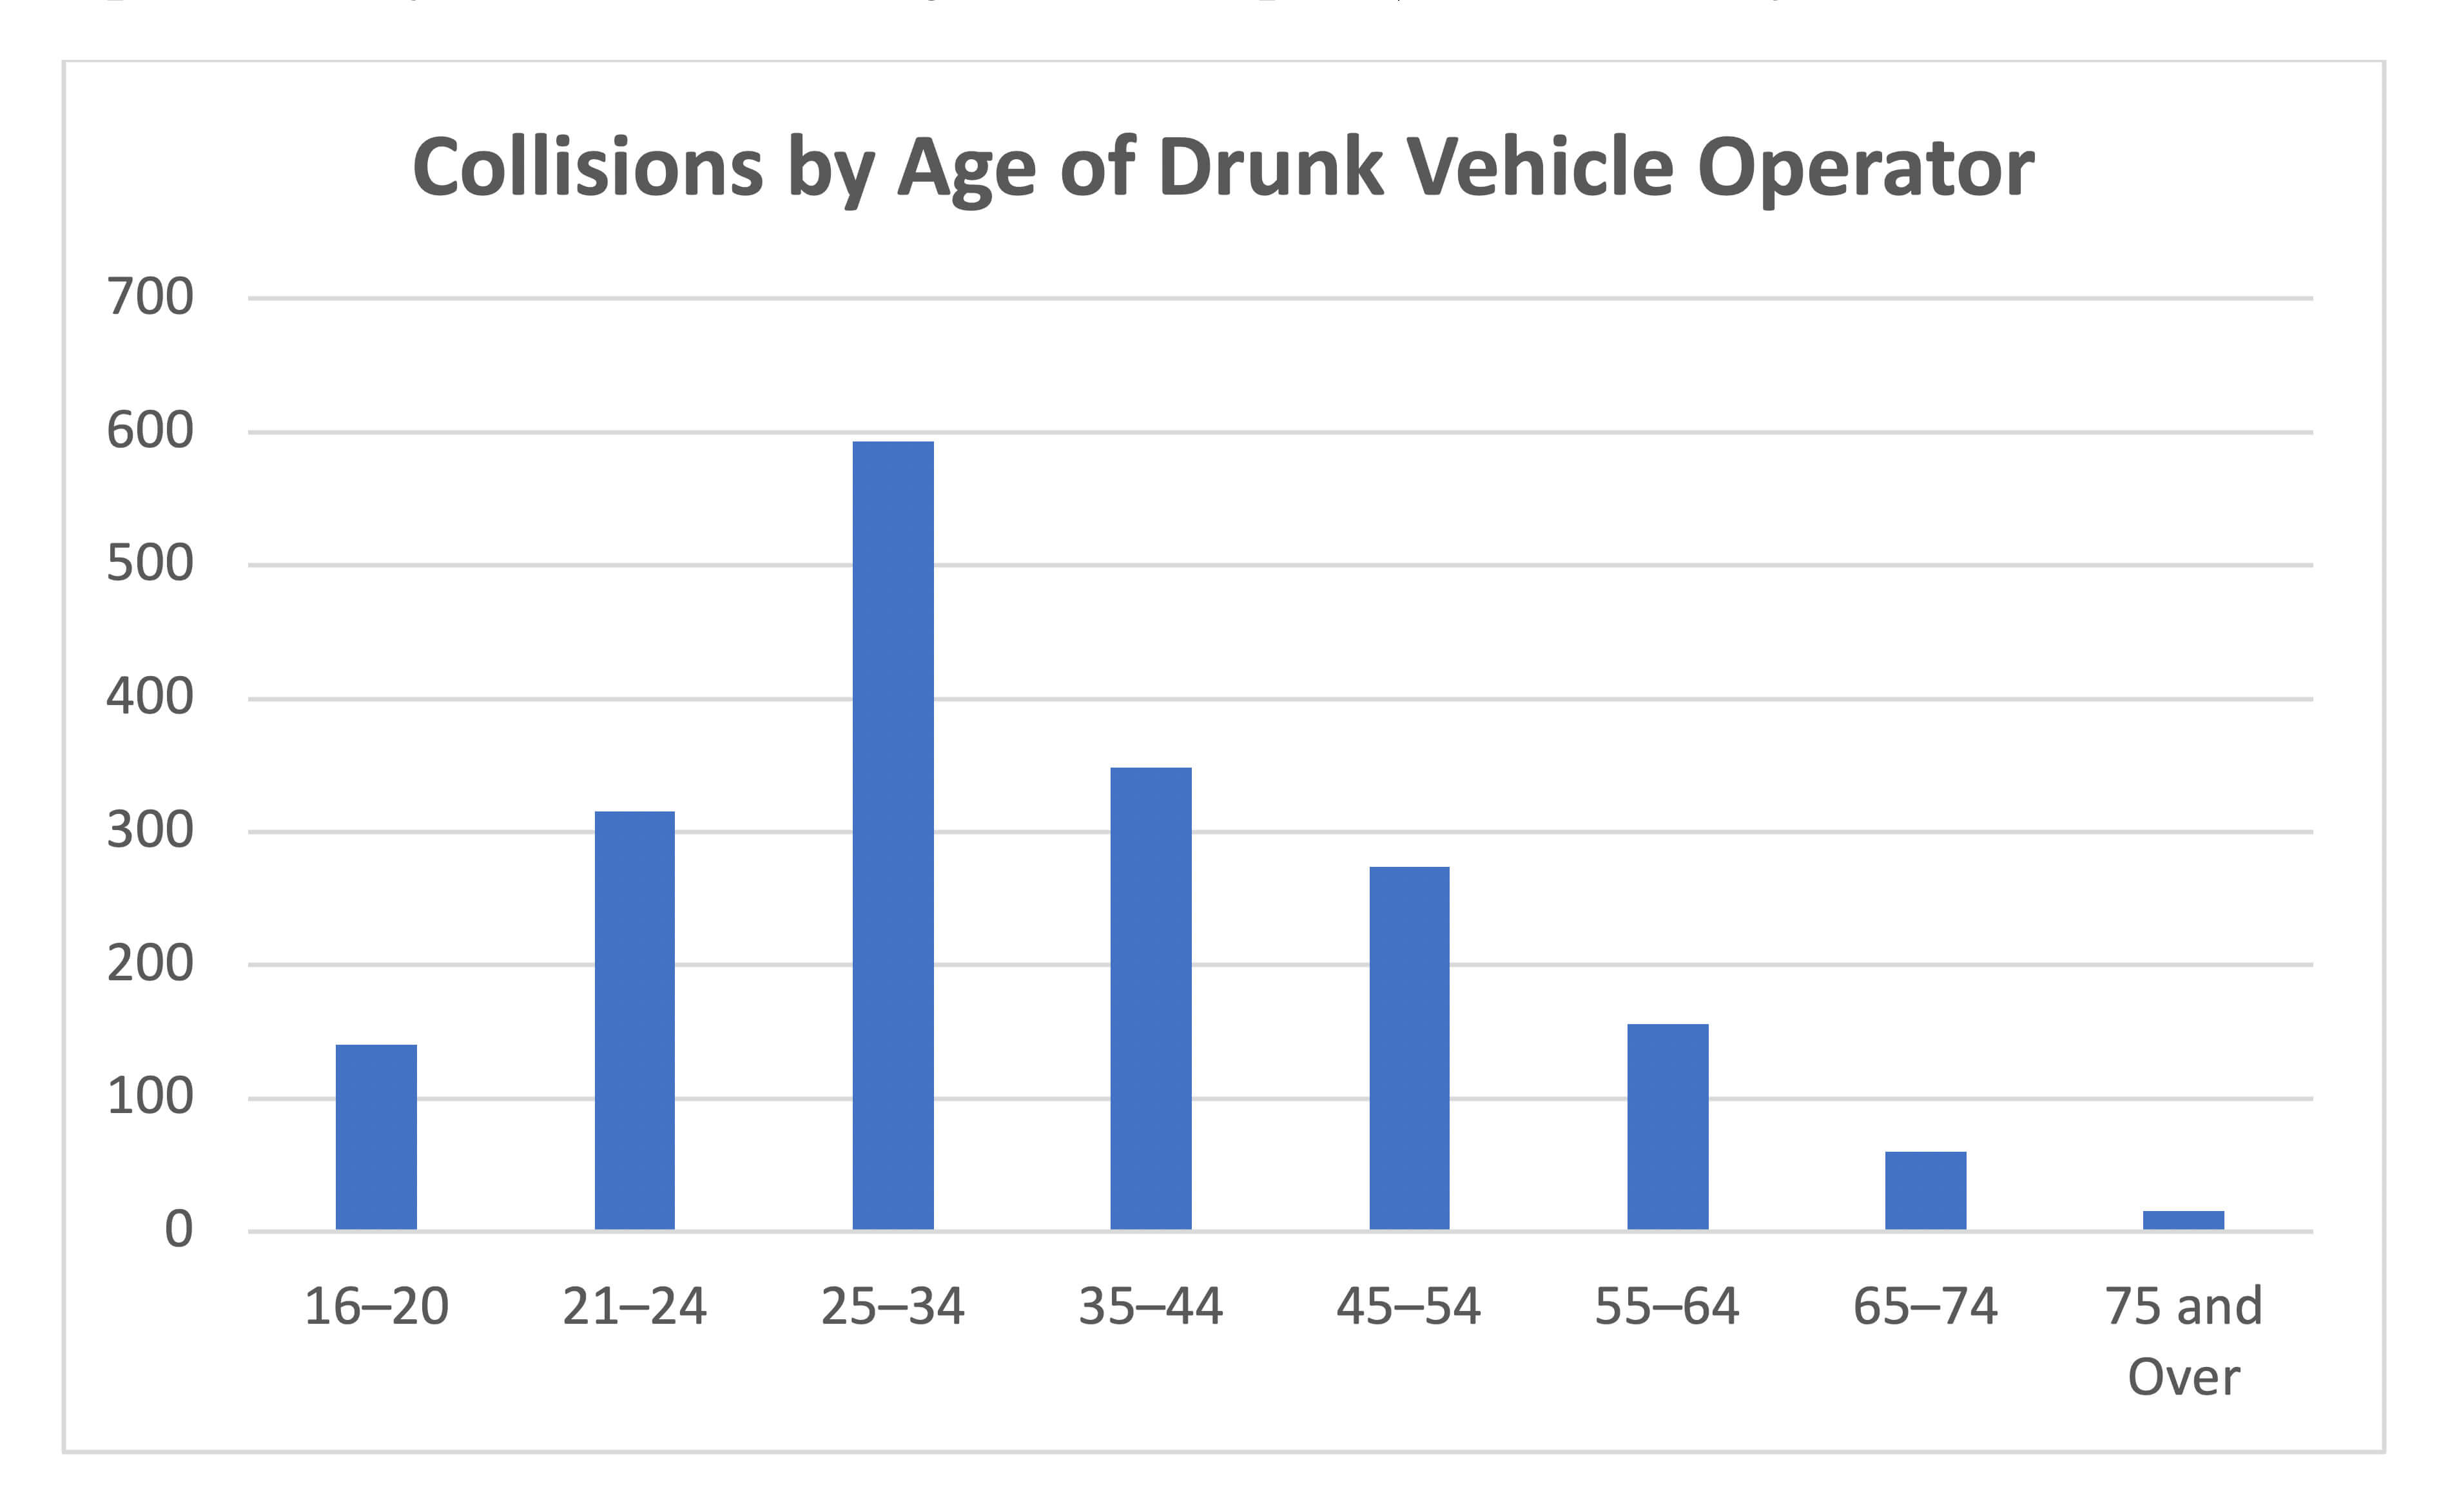
- In 2017, 133 people were killed in collisions involving a drunk driver. However, Ontario’s drinking and driving fatality rate was only 0.13 persons per 10,000 licensed drivers. This is the lowest drinking and driving fatality rate in North America, followed by Washington, DC (0.21). (Ontario Ministry of Transportation, 2017)
- In 2017, 75 people were killed in collisions involving a drugged driver. This represents about 1% of all traffic fatalities. (Ontario Ministry of Transportation, 2017)
- The following table lists the contributing factors involving the most fatalities, along with the number of fatalities and the percentage of the total. (Note that these percentages do not add up exactly to 100% because some fatalities involved more than one contributing factor.) (Ontario Ministry of Transportation, 2017)
| Number of Fatalities | Percentage of Total Fatalities | |
| Large Trucks | 141 | 23% |
| Drunk Driving | 133 | 22% |
| Pedestrians | 114 | 18% |
| Speed-Related | 114 | 18% |
| Distracted Driving | 107 | 17% |
| Unbelted Occupants | 87 | 14% |
| Drugged Driving | 74 | 12% |
| Motorcyclists | 69 | 11% |
| Senior Drivers | 25 | 4% |
| Young Drivers | 21 | 3% |
| Cyclists | 14 | 2% |
- Some roads and traffic intersections are much more dangerous than others. According to a poll of drivers conducted by CAA in 2018, the most dangerous spot in Ontario is Highway 401 between Windsor and London. It has been nicknamed “Carnage Alley” for its frequent collisions, many of which involved death or injury. Use extra caution if you drive on this section of road. (Greg Monforton and Partners, 2019)
- Rear-end collisions are the most common types of accidents in Ontario involving more than one vehicle. According to statistics compiled by the government, of the 35,972 motor vehicle crashes in 2016, 9,821 of them were rear-end collisions in which people were injured or killed. (Diamond & Diamond Lawyers, 2017)
- In 2013, there were 1,694 collisions in construction zones. Seven of these collisions led to the deaths of eight people, and another 341 of these collisions involved injuries. (Ontario Ministry of Transportation, 2013)
- In 2017, there were 25 fatalities among senior drivers age 80 and over, an increase of 47% from 17 in 2016. The number of licensed senior drivers (80+) has more than doubled over the past 20 years, from almost 125,000 in 1998 to approximately 320,000 in 2017. (Ontario Ministry of Transportation, 2017)
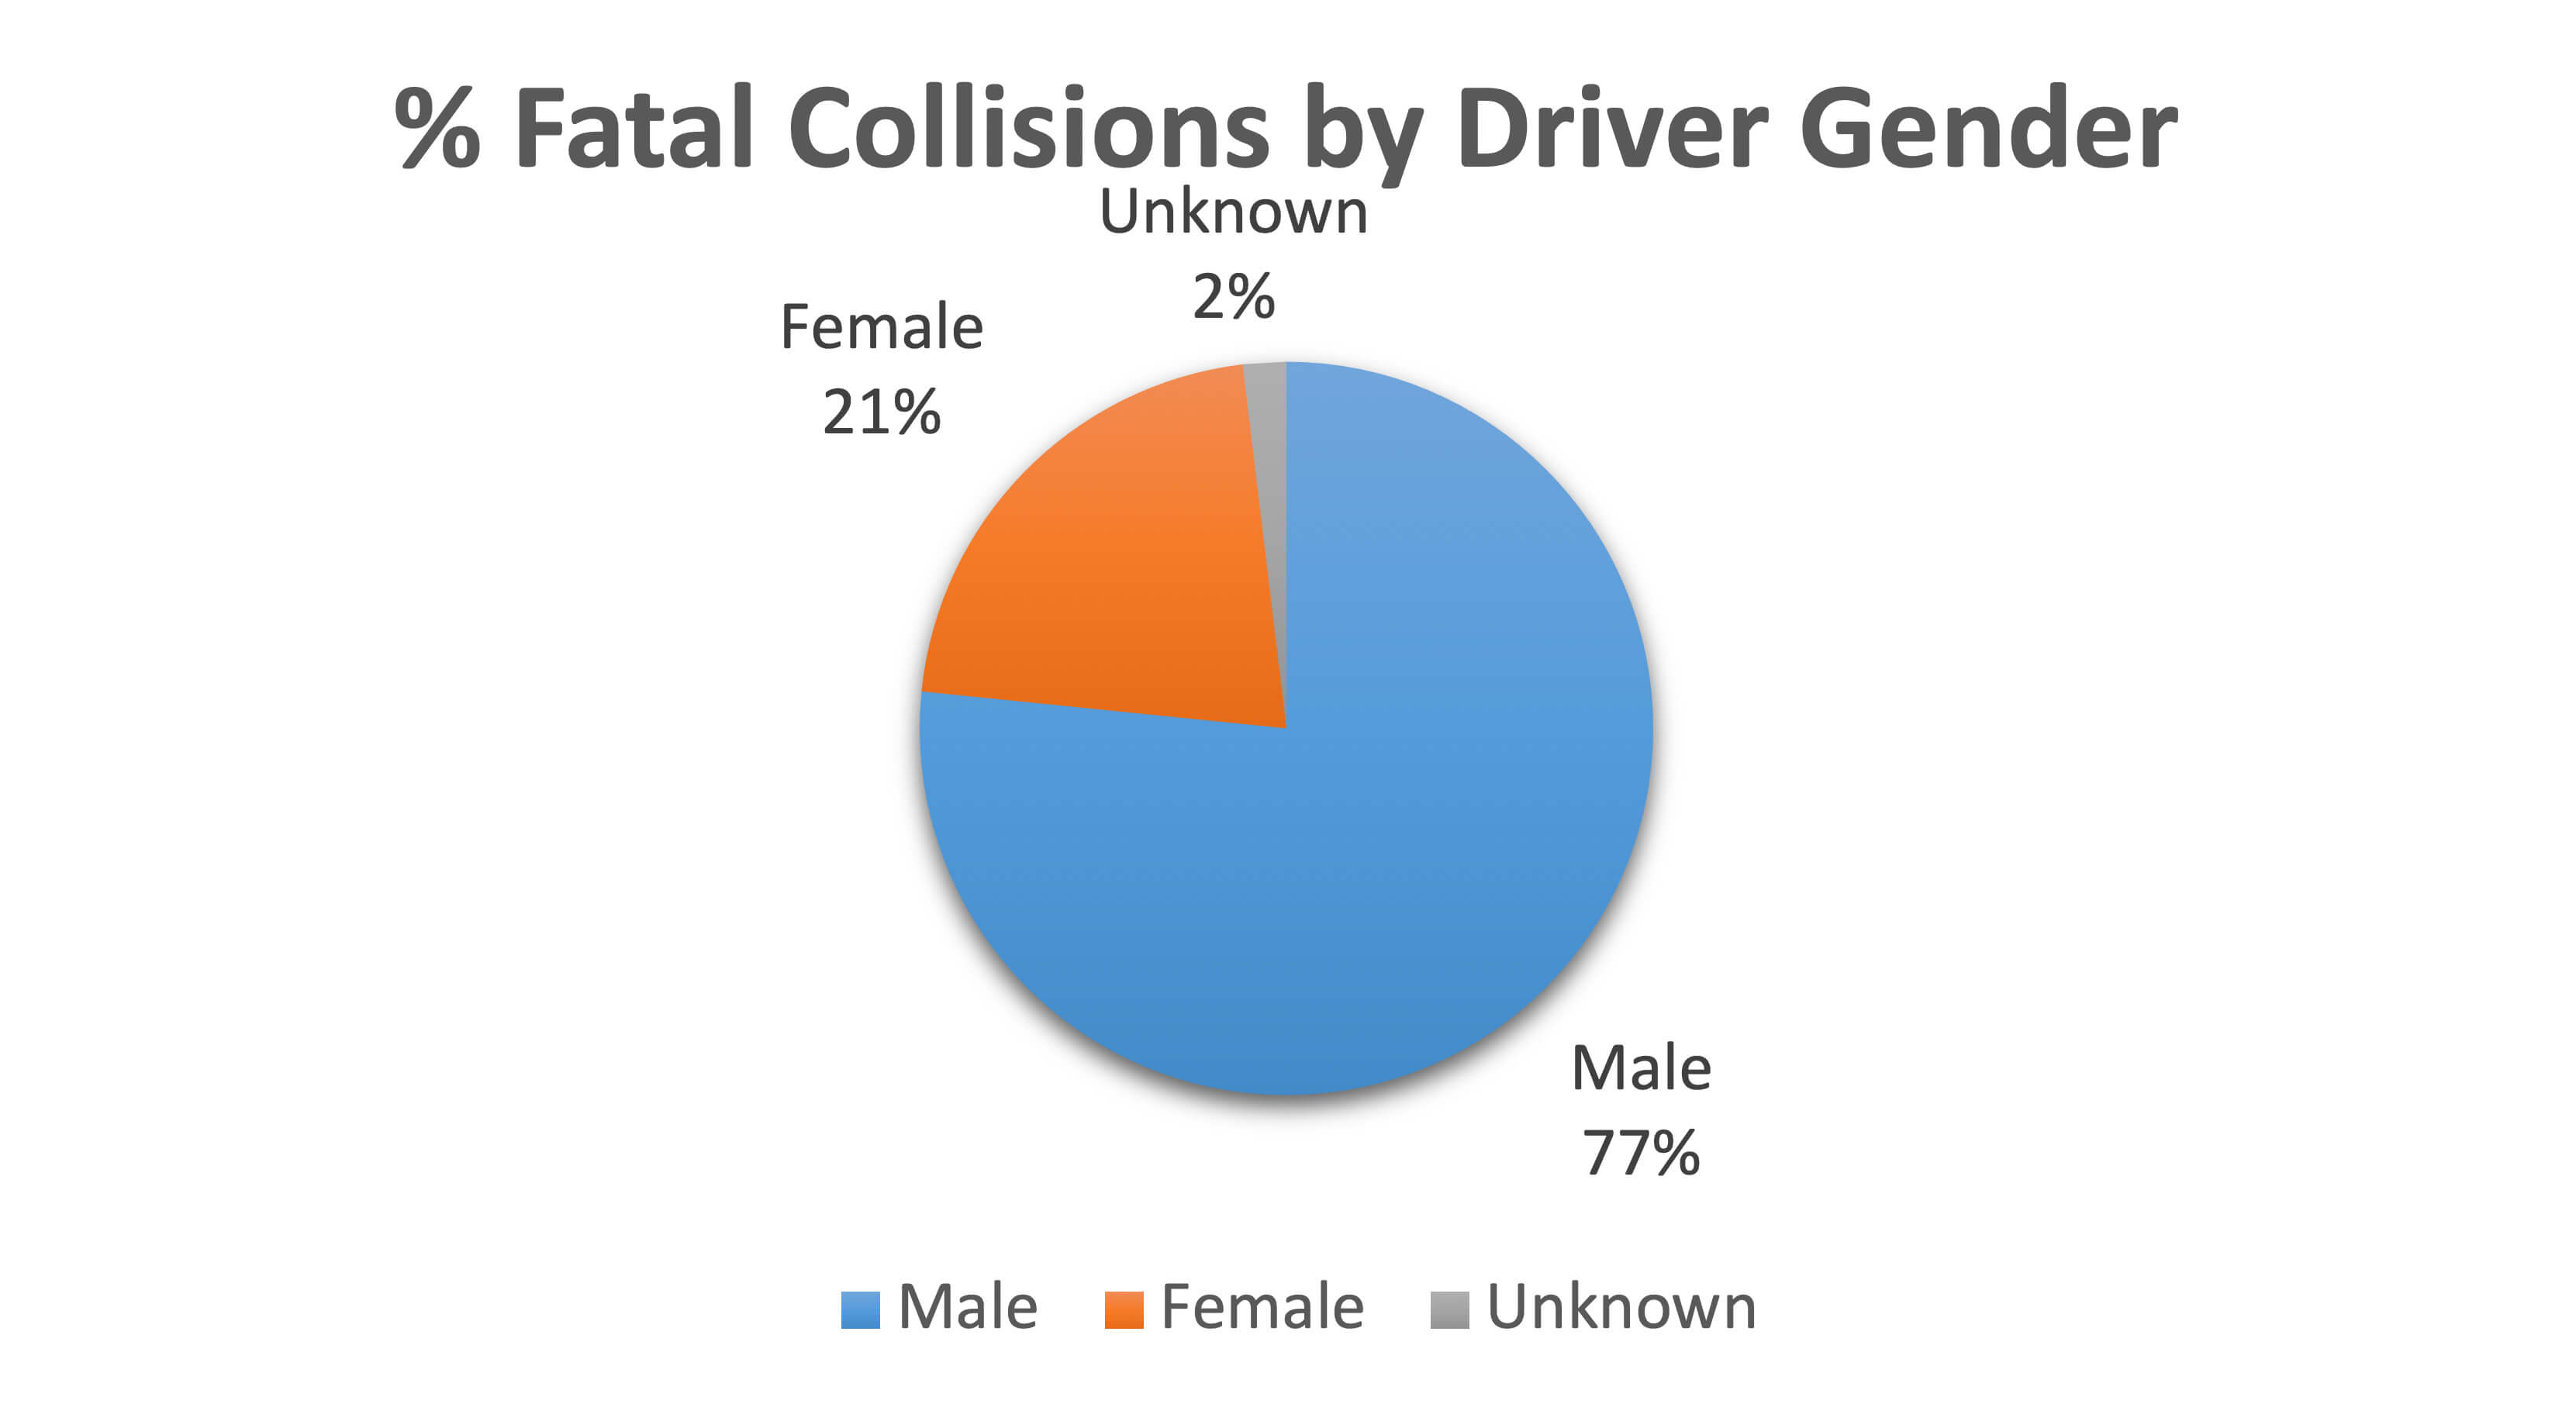
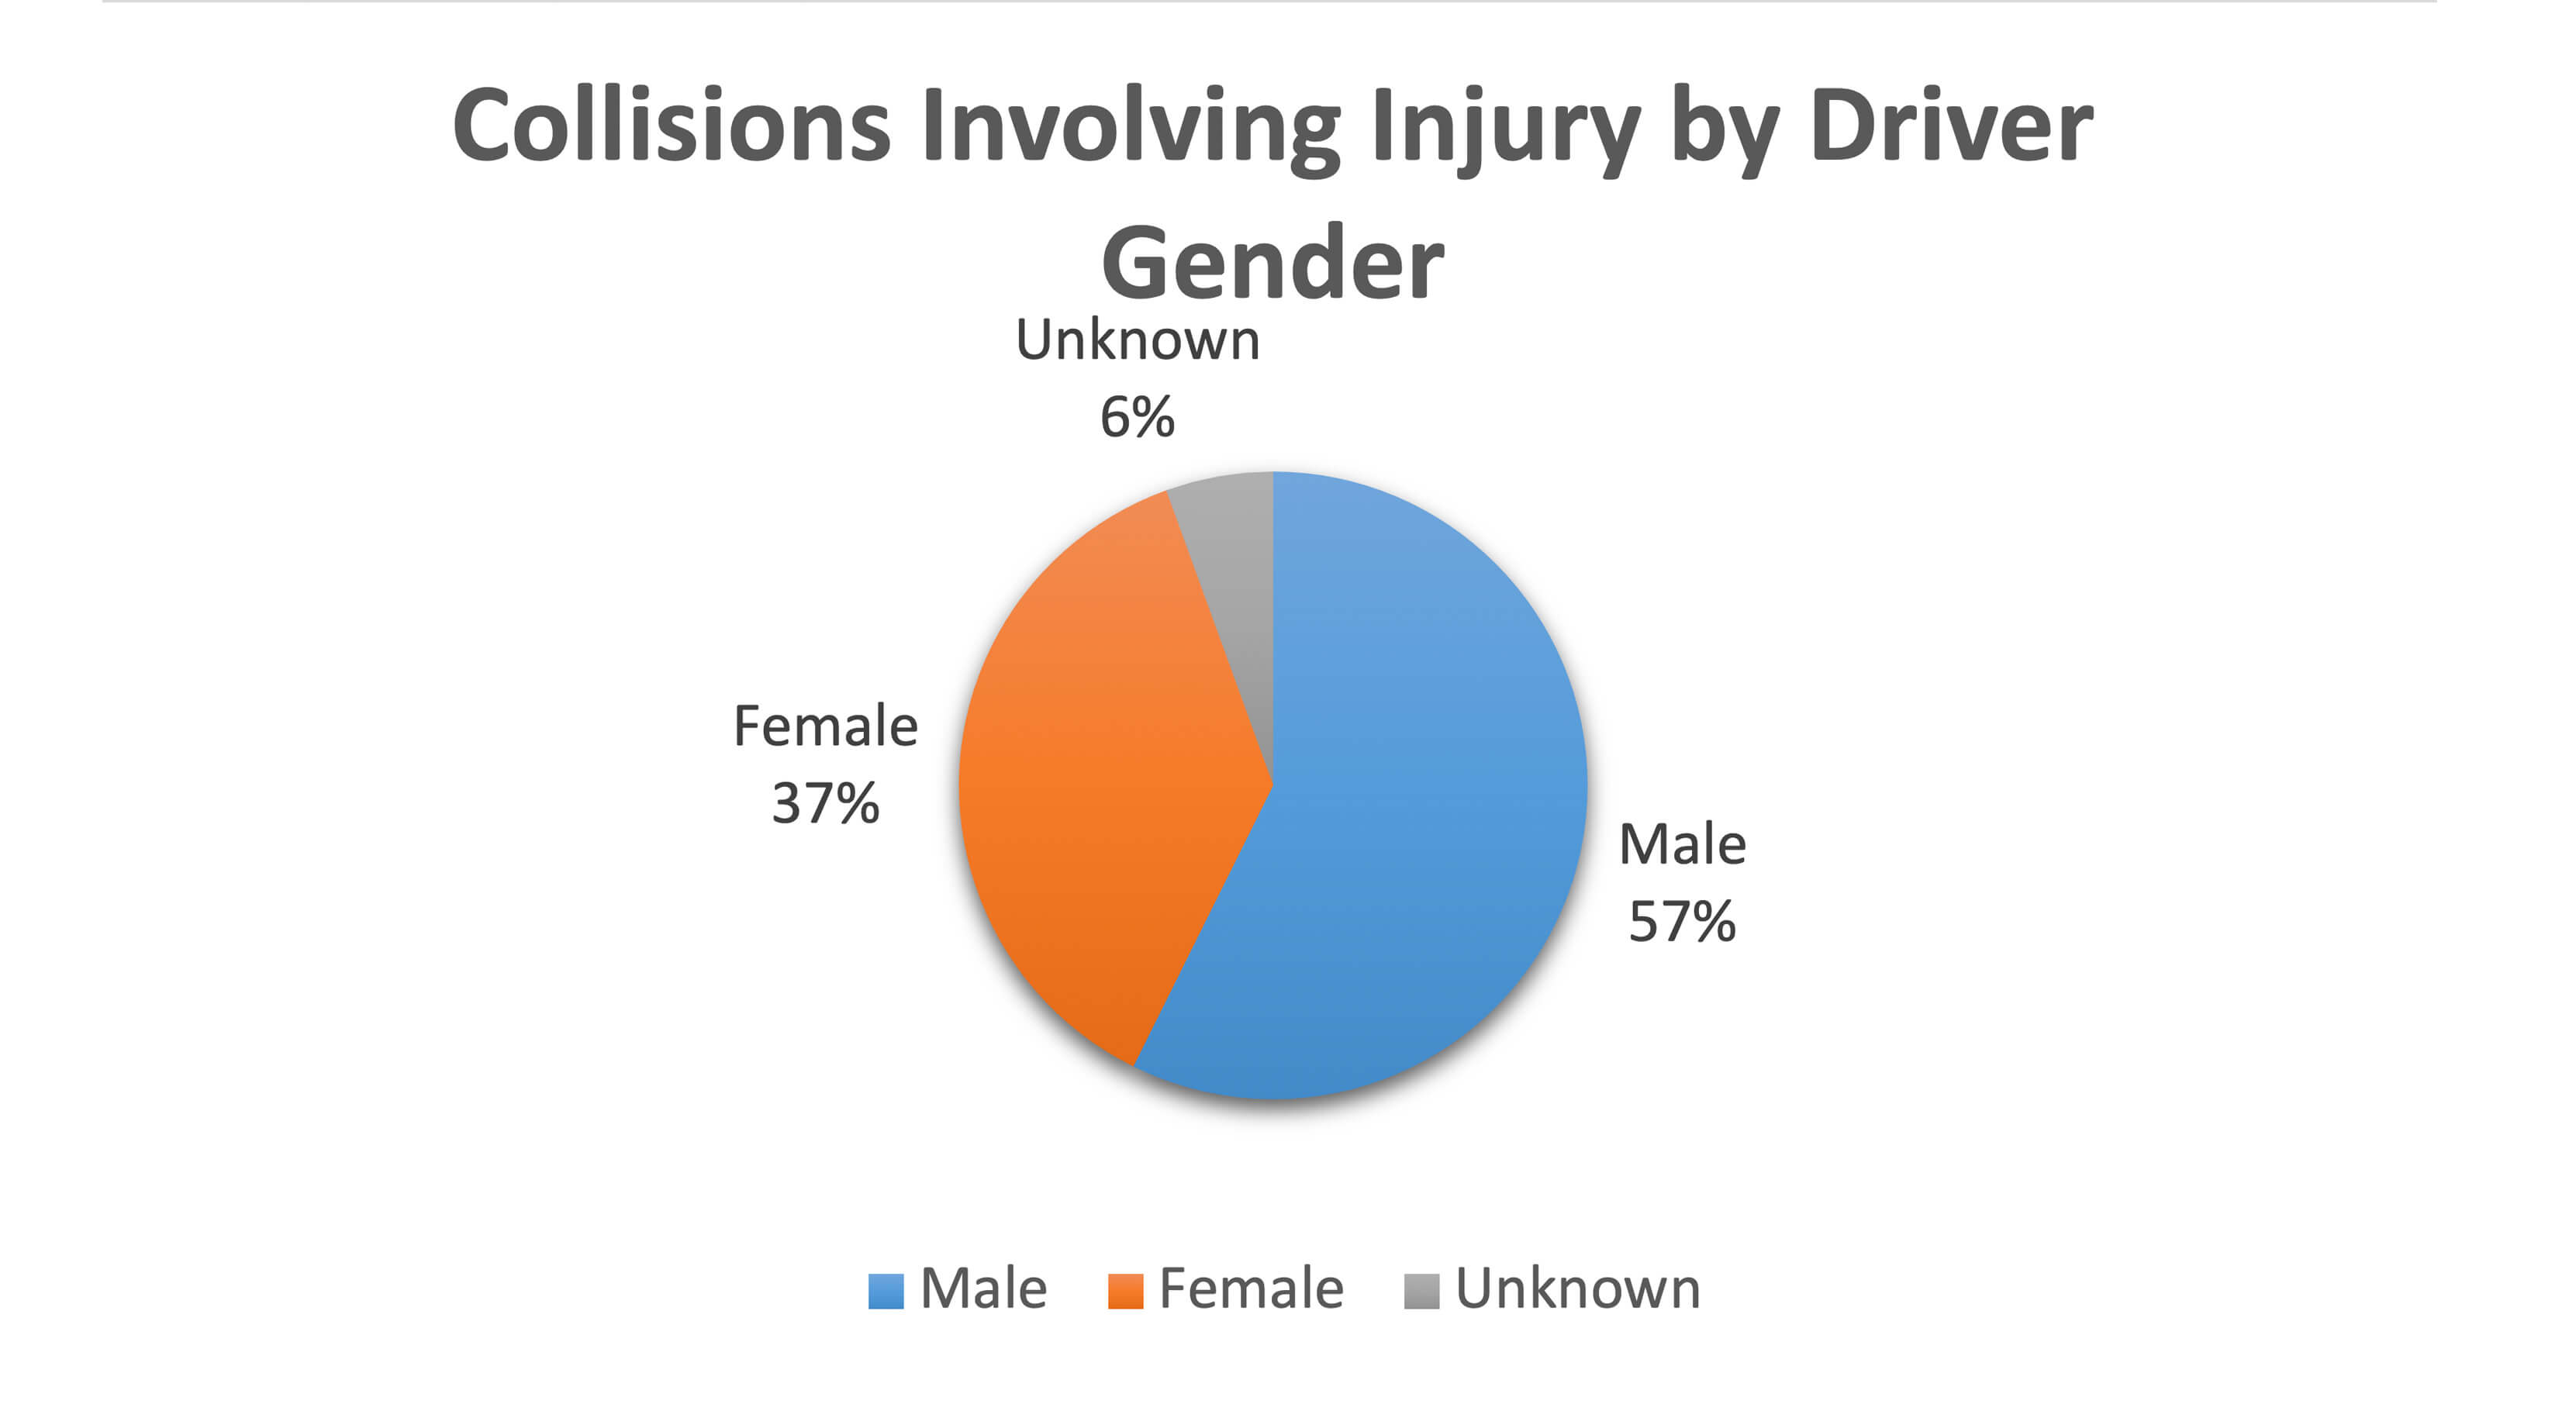
- In most collisions in 2017 involving death or personal injury, the driver was male. See the following charts. (Ontario Ministry of Transportation, 2017)
- Ontario has a 96% seatbelt usage rate. Nevertheless, about 1 out of 5 vehicle occupants killed on Ontario’s roads were unbelted. (Ontario Ministry of Transportation, 2017)
- Research by the Ontario Ministry of Transportation shows that some 26% of all fatal and injury crashes are estimated to be related to fatigued driving. In 2006, as many as 167,000 Ontario drivers may have been involved in at least one crash due to fatigued or drowsy driving. (Traffic Injury Research Foundation, 2009)
- In 2008, the Traffic Injury Research Foundation conducted a survey of Ontario police officers, including RCMP, provincial, and municipal forces. 95.9% of officers surveyed identified fatigued driving as a serious problem, and 89.2% of them ranked the problem as being as important as, or comparable to impaired driving. 92.4% of the officers who were surveyed also stated that they had stopped a driver whom they suspected to be impaired, only to discover that the driver was fatigued instead. However, whereas almost all officers considered fatigued driving a serious or extremely serious problem, only 59.6% of Ontario drivers agreed. (Traffic Injury Research Foundation, 2009)
- In a recent public opinion poll conducted by TIRF, nearly 60% of Ontario drivers, corresponding to some five million people, admitted that they have driven fatigued at least sometimes. Well over a million Ontario drivers (14.5%) also admit that they have fallen asleep or nodded off while driving at least once in the past year. Collectively, these drivers account for about 5.5 million trips in Ontario during which they fell asleep or nodded off. (Traffic Injury Research Foundation, 2009)
- In another poll of Ontario drivers, the most frequently cited reason for driving fatigued was lack of sleep the night before. (Traffic Injury Research Foundation, 2007)